Warehouse costs as % of salesTransportation costs as % of salesFinished goods inventory turnsRaw materials inventory turnsInventory obsolescenceWork in progress daysFinished goods days
Raw material daysInbound delivery in fullInbound delivery on timeOutbound delivery in fullOutbound delivery on timeManufacturing cycle time
The Three-Level Hierarchy
A three-tier KPI solution is a little more involved, with the top two tiers comprising end-to-end supply chain metrics with Tier 2 being more granular than Tier 1.
Meanwhile, the third tier can include KPIs that show performance at a functional level, and highlight how each function’s primary activities are contributing to end-to-end performance.
Whether you choose a two or three-tier system will depend on the specifics of your company’s business, the company’s size, and other similar factors.
Of course, it’s also possible to add further tiers for even more granularity, but again, the more levels you have, the more complex your KPI solution.
Now let’s get a little more granular in this study of supply chain KPIs, and look at some of the specifics involved in tracking cross-functional and functional performance.
Cross-Functional and Functional KPIs: How to Apply the Right Ones
Functional KPIs offer value, of course, but when you combine and integrate them to offer an end-to-end view of performance trends, you can magnify that value considerably.
It can be helpful, therefore, to identify the processes involved in your supply chain before deciding upon the functional-specific measures that collectively, will show how these processes are performing.
You can identify and categorize your company’s processes in any way that suits you.
Still, it’s worth briefly discussing, as an example, one of the process cycles commonly used when monitoring supply chain performance.
That cycle typically goes under the heading of order-to-cash.
Order to Cash
Order to Cash (OTC) is the end-to-end process involved in capturing and fulfilling a customer’s order, and can be measured using a carefully coordinated range of functional KPIs.
The OTC cycle loosely comprises the following sub-processes:
Customer-order captureOrder picking and packingDispatching, shipping, and delivering the orderBilling the customerReceiving and recording the customer’s payment
OTC is a process that illustrates clearly, how the supply chain comprises a broader range of business functions than you might have thought.
For example, the sales function is not typically seen as part of the supply chain, but if your sales team captures orders from your customers, the first step in the supply chain is very much sales-related.
Similarly, it’s easy to forget that a supply chain comprises the flow of information and money, as well as goods.
That necessarily implies a need for financial functions to be measured if you want a full picture of end-to-end supply chain performance.
Who’s Involved in Order to Cash Measurement?
When you measure the order-to-cash cycle, you will need to set appropriate KPIs for your sales department, warehousing and transportation functions, and for some areas of finance, such as accounts receivable.
To illustrate how much this matters, consider the possible consequences of any failure or delay in recording a customer’s payment.
Let's assume a system or process issue that results in the delayed posting of the customer's payment.
If the customer makes frequent purchases, receipt of payment for the previous delivery might not be recorded before the customer places a fresh order.
Because there is no record of payment, the customer's account might be put on hold in your ERP system, and the whole process of supplying that customer stops until somebody spots the problem and resolves it.
That’s a supply chain performance issue, just as much as if your warehouse team fails to pick the order.
Functional KPIs in OTC
If you’re beginning to think that order-to-cash cycle measurement sounds incredibly complicated, you can relax a little, because it need not be that hard.
For one thing, a made-to-measure (see what I did there?) KPI exists that’s relevant to pretty much any type of supply chain operation.
It’s a composite KPI called
perfect order, and it incorporates functional measurements for all stages of the OTC process.
You can use the perfect order KPI to track OTC performance, by breaking it into its components and applying the metrics as relevant to the different functions in your supply chain.
The breakdown should look something like this:
Sales function: Percentage of orders captured accurately (reliant on customer feedback)Warehouse function: Percentage of orders picked in fullTransport function: Percentage of orders delivered in full; Percentage of on-time deliveriesFinance function: Percentage of orders billed correctlyAll functions: Percentage of orders with correct and accurate documentation
The functional KPIs mentioned above are the highest level of metrics that you will use.
They will likely need breaking down further to maximize identification of performance issues and aid in solution planning—always remembering to keep things simple by only holding people responsible for the KPIs they can directly affect.
For instance, in the warehouse, the percentage of orders picked in full might be broken down into…
Percentage of orders picked with errors – incorrect quantityPercentage of orders picked with errors – incorrect productPercentage of order lines picked with errors - incorrect quantityPercentage of order lines picked with errors - incorrect product
At this level of granularity, the picking-performance measurement will allow you to see trends and patterns in picking accuracy.
You might notice, for example, that a significant number of orders are picked with minor errors, or that a small number of orders contains many errors.
Furthermore, by applying codes to highlight the exact nature of each error, you will gain an even higher level of visibility.
You might notice, for instance, that a particular product is affected more than others by picking errors, and then determine if the problem lies with that product's markings, labels, storage location, or proximity to a similar product in the slotting plan.
What Makes an Effective KPI Suite?
Earlier, I mentioned that the SMART acronym might be a little too simple to use as a standard for developing KPIs.
As a more practical guide, you might wish to apply the following list of golden rules when building up a suite of logistics KPIs for your company:
1) Make sure you align all KPIs with the overall business objectives of your company.
2) Ensure that each KPI has an “owner”, whether that is an individual or a group of people.
3) Design each KPI as a leading metric, able to assist with the prediction of performance issues.
4) KPIs should be actionable, providing timely, accurate data that owners can interpret and utilise.
5) Each KPI should be easy for its owners to understand.
6) Each KPI should reinforce and/or balance others.
7) No KPI should contradict or undermine the others.
8) Each KPI should have a target or threshold indicating a minimum-acceptable level of performance.
9) As each KPI is proved stable and effective, it should be reinforced by incentives or compensation.
10) Each KPI should be update-able, as they will lose relevance over time.
The one caveat I would add here, concerning golden rule #9, is that it’s essential to incentivise only behaviours that do not jeopardise health and safety or regulatory compliance, or otherwise put the reputation of your business at risk.
Success With Supply Chain KPIs: A Brief Case Study
In the early years of this century, a British division of a global brewing company decided to diversify into contract distribution to increase utilization and reduce costs across its national warehousing and logistics operation.
The company’s customers mainly comprised pubs and restaurants, which were either under individual ownership, or owned by the brewing company.
However, the traditional model for licensed alcohol sales was undergoing a transformation, with most of the major brewers disposing of their estates following freshly introduced laws, implemented to curb what was seen by the government as a barrier to fair competition in the industry.
As a result of these changes, several large pub companies sprang up, and the brewing company (the subject of this study) determined to sell distribution services to these entities.
It won a porterage contract with one of the largest pubcos and suddenly found itself with one customer that represented more than 50% of its business revenue.
Threats and Measures: A Catalyst for Change
It wasn’t long before problems arose, with the customer threatening to exit the contract under a service-level clause.
Fortunately, the pubco’s director was an ex-logistics guy who proposed an alternative solution.
The customer and the supplier would work together to develop KPIs that would highlight why many pubs were receiving deliveries with incorrect product quantities, and why even more deliveries were arriving late.
The partners developed a KPI portfolio, which, although hardly simple in the way this article advocates, served to highlight some severe issues in the supplier’s warehouse and transportation functions.
The list of KPIs included delivery on-time and in-full (DIFOT).
The in-full KPI was broken down into factors such as:
Need Further Assistance?
Here at Logistics Bureau we have 20 years of experience in assisting clients with Supply Chain Benchmarking, and the development of suitable KPIs.
We have benchmarked almost 1,000 Supply Chains! We can help you:
Select the right KPIsFor the right level of managementSet the right targets for those KPIsAnd assess your current performance
Some More KPI Related Pages:
At Benchmarking Success.
Online KPIs
And on this site:
What is a KPI?Free Report on KPIsKPIs and Benchmarking
Have you seen our latest Supply Chain Benchmarking promotion? Go to this page: https://www.logisticsbureau.com/supplychainbenchmarker/
Want a 25 page KPI report for your industry?
To see if you are leading the pack or falling behind, you can buy the report instantly
here.
The download comes with many added bonuses as well.
Editor's Note: We first published this post in May 2013.
It has since been revamped and updated with more comprehensive information.
The most recent updates were made in September 2019.
Key Performance Indicators (KPIs) in Power Pivot
Key performance indicators (KPIs) are visual measures of performance.
Based on a specific calculated field, a KPI is designed to help users quickly evaluate the current value and status of a metric against a defined target.
The KPI gauges the performance of the value, defined by a Base measure (also known as a calculated field in Power Pivot in Excel 2013), against a Target value, also defined by a measure or by an absolute value.
If your model has no measures, see
Create a measure.
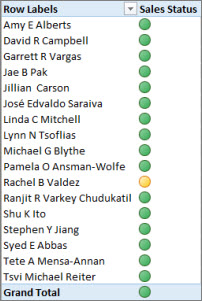
PivotTable with Employee Full Name in rows and Sales KPI in values
Create a KPI
In Data View, click the table that has the measure that will serve as the Base measure.
If you have not already created a base measure, see
Create a measure.
Make sure the Calculation Area is displayed.
If it is not showing, in Power Pivot, click
Home>
Calculation Area.
The Calculation Area appears beneath the table in which you are currently in.
In the Calculation Area, right-click the calculated field that will serve as the base measure (value), and then click
Create KPI.
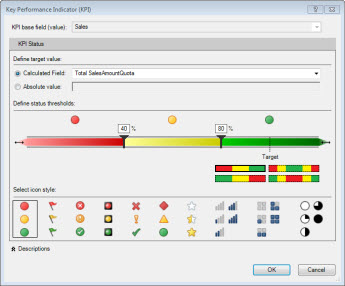
In
Define target value, select from one of the following:
Select
Measure, and then select a target measure in the box.
Note: If there are no fields in the box, there are no calculated fields in the model.
You need to
create a measure.
Select
Absolute value, and then type a numerical value.
In
Define status thresholds, click and slide the low and high threshold values.
In
Select icon style, click an image type.
Click
Descriptions, and then type descriptions for KPI, Value, Status, and Target.
Edit a KPI
In the Calculation Area, right-click the measure that serves as the base measure (value) of the KPI, and then click
Edit KPI Settings.
Delete a KPI
In the Calculation Area, right-click the measure that serves as the base measure (value) of the KPI, and then click
Delete KPI.
Deleting a KPI does not delete the base measure or target measure (if one was defined).
More about KPIs
In business terminology, a KPI is a quantifiable measurement for gauging business objectives.
For example, the sales department of an organization might use a KPI to measure monthly gross profit against projected gross profit.
The accounting department might measure monthly expenditures against revenue to evaluate costs, and a human resources department might measure quarterly employee turnover.
Each is an example of a KPI.
Business professionals frequently use KPIs that are grouped together in a business scorecard to obtain a quick and accurate historical summary of business success or to identify trends.
A KPI includes:
Base value
A Base value is defined by a calculated field that resolves to a value.
This value, for example, can be created as an aggregate of sales or created to define profit for a given period.
Target value
A Target value is defined by a calculated field that resolves to a value, or by an absolute value.
For example, a calculated field could be used as a target value where the business managers of an organization want to compare how the sales department is tracking toward a given quota, where the budget calculated field would represent the target value.
An example where an absolute value would be used as a target value could be where the HR manager would like to evaluate each employee’s number of sick-leave days compared to the average, where the average number of sick-leave days represents the absolute value.
Status thresholds
A Status threshold is defined by the range between a low and high threshold.
The Status threshold displays with a graphic to help users easily determine the status of the Base value compared to the Target value.
Example
The sales manager at Adventure Works wants to create a PivotTable she can use to quickly display whether or not sales employees are meeting their sales quota for a given period (year).
For each sales employee, she wants the PivotTable to display the actual sales amount in dollars, the sales quota amount in dollars, and a simple graphic display showing the status of whether or not each sales employee is below, at, or above their sales quota.
She wants to be able to slice the data by year.
To do this, the sales manager chooses to add a Sales KPI to the AdventureWorks workbook.
The sales manager will then create a PivotTable with the fields (calculated fields and KPI) and slicers to analyze whether or not the sales force is meeting their quotas.
In Power Pivot, a calculated field on the SalesAmount column in the FactResellerSales table, which gives the actual sales amount in dollars for each sales employee is created.
This calculated field will define the Base value of the KPI.
The sales manager can select a column and click
AutoSum on the
Home tab or type a formula in the formula bar.
The Sales calculated field is created with the following formula:
Sales:=Sum(FactResellerSales[SalesAmount])
The SalesAmountQuota column in the FactSalesQuota table has a sales amount quota defined for each employee.
The values in this column will serve as the Target calculated field (value) in the KPI.
The SalesAmountQuota calculated field is created with the following formula:
Target SalesAmountQuota:=Sum(FactSalesQuota[SalesAmountQuota])
Note: There is a relationship between the EmployeeKey column in the FactSalesQuota table and the EmployeeKey in the DimEmployees table.
This relationship is necessary so that each sales employee in the DimEmployee table is represented in the FactSalesQuota table.
Now that calculated fields have been created to serve as the Base value and Target value of the KPI, the Sales calculated field is extended to a new Sales KPI.
In the Sales KPI, the Target SalesAmountQuota calculated field is defined as the Target value.
The Status threshold is defined as a range by percentage, the target of which is 100% meaning actual sales defined by the Sales calculated field met the quota amount defined in the Target SalesAmountQuota calculated field.
Low and High percentages are defined on the status bar, and a graphic type is selected.
Key Performance Indicators in Power Pivot
The sales manager can now create a PivotTable adding the KPI’s Base value, Target value, and Status to the Values field.
The Employees column is added to the RowLabel field, and the CalendarYear column is added as a Slicer.
The sales manager can now quickly view sales status for the sales dept., slice by year the actual sales amount, sales quota amount, and status for each sales employee.
She can analyze sales trends over years to determine whether or not she needs to adjust the sales quota for a sales employee.
6 KPI's Your Home Services Business Should Be Tracking
When you own a small business, it can be hard to know how to measure success and make sure you're primed to grow.
There are, however, tried-and-true KPIs to help you monitor the trajectory of your company and correct the course as you face new challenges.
Running a small business can be daunting and in markets as competitive as HVAC, electrical, garage door repair and plumbing, you need to know how to keep the finger on the pulse of your operation.
By zeroing in on several key metrics, you can assess where your company is succeeding, where it could be doing more, and what can be done to ensure your business thrives.
Here are the six KPIs we recommend:
1. Sales Revenue
Sales revenue is simply how much money is coming in from the sale of your services (and any products you may offer).
This is a foundational metric essential for any company to stay in business, hire staff, adjust inventory, and so on.
It’s also important to look for trends in your sales revenue.
Do you experience spikes or slow periods during certain seasons? Distinguishing and anticipating these trends can help you make long-term financial decisions and ensure longevity.
2. Gross Margin
Your gross margin is your sales revenue minus the cost of providing services, divided by sales revenue.
Gross margin is expressed as a percentage and can help you track the growth of your business.
This percentage represents the amount of every dollar from your sales revenue you retain as profit.
If the percentage is high, your efficiency is good.
If it is low, then look into increasing productivity.
Tracking expenses — and then properly applying to your bookkeeping every month —
is more complicated than it sounds.
Remember not to close out your month’s numbers until accurately assigning the expenses to the services provided over that time period.
Part of this includes tracking materials used from your inventory only when they are used for booked jobs (rather than calculating an incoming stocking order as one large expense for the month).
3. Monthly Profit/Loss
There is another number that needs to subtracted from your profit to determine your monthly profit (or loss): fixed and variable operation costs.
Fixed costs are regular costs you pay every month:
Rent
Utilities
Staff salaries
Advertising
Variable costs are unexpected costs that may fluctuate month-to-month, like gas usage, repair services at your office and so on.
Both fixed and variable costs every month are subtracted by your profits to calculate the money your company is bringing in.
If you find that your total costs are eating up a significant part of your profits, look into where you can start saving money every month.
A good rule of thumb is try and keep the total cost of operations (fixed + variable) at 30% or under.
4. Various Service Metrics
Do you know how long it usually takes for your techs to perform a certain install? How many service calls your techs can complete in one day? How often you sell a particular service in one month?
The revenue of your average ticket? The close rate of each of your techs? There are many different numbers you can derive from tracking tech performance and customer buying trends.
Track what you can, and over time you’ll find the the service metrics that are the most valuable for measuring your business’ success.
For Weldon Long, President of Wright Total Indoor Comfort, that metric was revenue per lead.
As Long told Contracting Business: “Revenue per lead is total volume divided by total number of leads, including cancelled leads, sold, lost, everything.
If a guy had 40 leads in a month and did a total of $100,000 in sales, you have $2,500 per lead.
That's the best metric we've found."
5. Customer Retention
How good is your company at inspiring loyalty among its customers? Returning customers can dramatically increase a home services company’s revenue.
Use customer service surveys or simple asks on the day of service to gain insight on how many customers keep coming back to your service (and, if possible, why).
Net Promoter Score, a tool used to gauge the loyalty of one’s customers, asks customers to answer a simple question on a scale of 1-10, “How likely are you to recommend (this company, this product, this experience, this representative) to your friends, family or business associates?” Customers who score between 0 and 6 are unlikely to give you repeat business while customers who score between 9 and 10 are likely to be promoters of your business or service.
If you find that your business is subsisting on many one-time, low-scoring customers, look at your customer services practices or implement retention campaigns (such as discounts) to bring customers back.
6. Advertising ROI
If you make the effort to invest in advertising — whether it be online, radio, print, TV or elsewhere — make sure you have some system in place to measure the return on your investment.
Customer surveys and CSR/tech inquiries to customers can help you understand where new customers and coming from and end costly advertising campaigns that may not be effective.
If you run various online ads (Facebook, Google PCP, Yelp paid listings, etc.), make sure that you get answers that specify which platform customers are using when they encounter your ads.
To calculate your advertising ROI, divide the returns (revenue) resulting from the campaign by the cost of the campaign.
KPI Examples
Performance management starts with figuring out what to measure.
Customer Service
Agent's full-time employees (FTEs) as percentage of total call center FTEs
Answering percentage (number of sales calls answered/total number of sales calls offered)
Average after-call work time
Average number of calls/ service request per handler
Average queue time of incoming phone calls
Cost per minute of handle time
Costs of operating call center/ service desk
Email backlog
Field service technician utilization
Hit rate (products sold compared to total received sales calls)
Inbound abandon rate
Inbound agent dialed calls
Inbound availability rate
Inbound average talk time
Inbound average wrap time
Inbound call center leads created
Inbound call center opportunities created
Inbound calls handled
Inbound calls handled per agent hour
Inbound service level
Number of complaints
Percentage of customer service requests answered in given timeframe
Percentage of calls transferred
Total calling time per day/week/month
Finance
Accounting costs
Accounts payable turnover
Accounts receivable collection period
Accounts receivable turnover
Actual expenses
Amount due (per customer)
Average customer receivable
Average monetary value of invoices outstanding
Average monetary value of overdue invoices
Average number of trackbacks per post
Budget variance for each key metric
Budgeted expenses
Capital expenditures
Cash conversion cycle (CCC)
Cash flow return on investments (CFROI)
Cost of goods sold (COGS)
Cash dividends paid
Cost per pay slip issued
Creditor days
Current receivables
Cumulative annual growth rate (CAGR)
Cycle time for expense reimbursements
Cycle time to process payroll
Cycle time to resolve an invoice error
Cycle time to resolve payroll errors
Days payable
Debtor days
Direct cost
Discounted cash flow
Earnings before interest and taxes (EBIT)
Earnings before interest, taxes, depreciation (EBITDA)
Economic value added (EVA)
Employee available time
Employee scheduled time
Employee work center loading
Enterprise value/ takeover value
Expense account credit transactions
Expense account debit transactions
Expense account transactions
Fixed costs
Gross profit
Gross profit margin
Indirect costs
Inventory turnover
Inventory value
Invoice processing costs
Internal rate of return (IRR)
Market share gain comparison percentage
Net change in cash
Net income
Net present value (NPV)
Number of invoices outstanding
Number of unapplied receipts
Number of past-due loans
Open receivables
Open receivables amount (per customer)
Operating leverage
Past-due receivables
Payables turnover
Payment errors as a percentage of total payroll disbursement
Percentage accuracy of financial reports
Percentage of bad debts against invoiced revenue
Percentage of electronic invoices
Percentage in dispute (per customer)
Percentage of invoices being queried
Percentage of invoices requiring special payment
Percentage of low-value invoices
Percentage of open receivables (per customer)
Percentage of payable invoices without purchase order
Percentage of service requests posted via web (self-help)
Perfect order measure
Quick ratio
Receivables
Receivables turnover
Return on capital employed (ROCE)
Sales growth
Share price
Systems cost of payroll process as a percentage of total payroll cost
Total payables
Total energy used per unit of production
Total receivables
Total sales
Unapplied receipts
Variable costs
Weighted days delinquent sales outstanding
Weighted days delinquent sales outstanding (per customer)
Weighted terms outstanding
Weighted terms outstanding (per customer)
Human Resources (HR)
Actual versus budgeted cost of hire
Annualized voluntary employee turnover rate
Annualized voluntary turnover rate
Average headcount of employees each human resources (HR) employee working is caring for
Average interviewing costs
Average length of placement in months for the manager
Average length of service of all current employees
Average length of service of all employees who have separated
Average months placement
Average number of training hours per employee
Average number of vacation days per employee
Average performance scores of departing employees
Average retirement age
Average salary
Average salary for all employees reporting to the selected manager
Average sourcing cost per hire
Average time employees are in same job/ function
Average time to competence
Average time to update employee records
Average training costs per employee
Compensation cost as a percentage of revenue
Contingent workers
Employee satisfaction with training
End placements
Female to male ratio
Full-time employees (FTEs) per human resources (HR) department FTE
Headcount of contingent workers for the manager
HR average years of service (incumbents)
HR average years of service (terminations)
HR department cost per FTE
HR headcount - Actual
HR headcount - Available
HR to employee staff ratio
Job vacancies as a percentage of all positions
New hire quality
Time to fill
Hiring manager satisfaction
Cost per hire
Staffing efficiency
Internal, external, and total headcount recruiting costs and ratios
Number of end placements made in the reporting period for the manager
Part-time employees as a percentage of total employees
Percentage of employees receiving regular performance reviews
Percentage of employees that are near or at max for their vacation balances
Percentage of HR budget spent on training
Percentage of new hire retention
Ratio of internal versus external training
Ratio of standard level wage to local minimum wage
Return on investment (ROI) of training
Total overtime hours as a percentage of all work hours
Training penetration rate (percentage of employees completing a course compared to all FTEs)
Workforce stability
Information Technology (IT)
Account create success
Account termination success
Active directory performance index
Alert-to-ticket ratio
Average data center availability
Call center PBX availability
Campus PBX availability
Customer connection effectiveness
Data center capacity consumed
Email client availability
Exchange server availability
Incidents from change
Internet proxy performance
Network availability - High availability sites
Network availability - Standard sites
Network manageability index
No problem found/duplicate tickets
Percentage of branch office backup success
Percentage of circuits exceeding target utilization
Percentage of IT managed servers patched at deadline
Percentage of production servers meeting software configuration standards
Percentage of security update restarts within maintenance window
Percentage successful remote access server (RAS) connections
Phone answer service level
Priority 1 and priority 2 network incidents meeting SLA
Product adoption status and compliance
Restore success rate
Server growth rate
Server manageability index
Service desk client satisfaction - Percentage dissatisfied
Service desk tier 1 resolution rate
Service desk time to escalate
Service desk time to resolve
Storage utility service availability
Storage utility utilization
Virtual machine provisioning interval
Virtual server utility availability
Web server availability
Marketing
Ad click-through ratio (CTR)
Average response rates of campaigns
Brand awareness percentage
Brand consideration
Brand credibility
Brand strength
Column inches of media coverage
Consumer awareness
Contact rate (number of contacts effectively contacted / number of contacts in the target list)
Cost per converted lead
Cost per lead
Cost per mille (CPM)
Delivery of materials
Effective reach
Gross rating point (GRP)
Growth sustainability rate of brand
Leads generated
Marketing budget awareness-demand ratio
Marketing budget ratio (MER)
Number of article placements in trade magazines
Number of client visits
Number of product focus groups conducted
Number of customer satisfaction surveys administered
Number of placements in trade magazines
Number of trade shows attended / participated in
Percentage of customers willing to promote your product/service
Q score (a way to measure the familiarity and appeal of a brand, etc.)
Response rate
Return on investment (ROI) of brand
Return on marketing investment (ROMI)
Revenue generation capabilities of brand
Staying in budget
Target rating point
Total cost of customer acquisition
Transaction value of brand
Website click-throughs
Website hits
Website leads generated
Sales
Actual calls
Actual sales value versus initial bid
Age of sales forecast
Average administrative time per sales person
Average deal size
Average number of activities (calls, meetings, etc.) to close a deal
Average price discount per product
Average price discount per sales person
Average revenue per product
Call quota
Closed sales
Closing ratio
Customer acquisitions costs as a percentage of sales value
Customer churn ratio
Customer loyalty
Customer purchase frequency
Customer satisfaction
Frequency of sales transactions
Gross margin per product
Gross margin per sales person
New sales person ramp-up time
Number of certified partners
Number of deals per partner
Number of sales orders by FTE
Number of sales people meeting their quota
Number of units sold per day/week/month/quarter/year
Partner churn ratio
Partner profit margin
Percentage of converted opportunities
Percentage of online sales revenue
Percentage of sales due to launched product/services
Percentage of sales representatives to achieve quota
Percentage of sales revenue via partner channel
Pipeline by sales stage
Qualified leads
Qualified opportunities
Revenue per sales person
Sales capacity
Sales cycle time
Sales per department
Sales person turnover
Sales quota
Time utilization
Unweighted sum of deal size in sales pipeline
Value of sales lost
Win/loss ratio percentage
Accommodation and Food Services
General
Average revenue per guest
Average revenue per table
Complaints per head
Complaints per order Labor cost per guest
Labor cost per table Minutes per table turn
Profit per table
Bar and cellar management
Average profit percentage on sales Carrying cost of stock Gross profit on sales
Sales and stocktaking discrepancies
Sales per head
Stock turnover
Stock value
Front of house and restaurant management
Front of house labor hours
Food, dessert, and beverage sales per head
Front of house labor percentage
Linen costs
Number of customers
Revenue per available seat hour (RevPASH)
Seating efficiency
Strike rate - Number of diners over number of occupying guests
Total sales per head - Total sales divided by the number of customers.
Kitchen management
Food cost percentage - Food cost over food sales
Food costs per head
Kitchen labor percentage - Kitchen labor cost over food sales
Kitchen labor hours - Over sales
Kitchen linen costs
Percentage of sales per selling items
Stock value
Total food costs
MANAGEMENT OF FINANCE AND ADMINISTRATION
Cash position at bank
Administration labor costs
Computer and technology efficiency (percentage of downtime, POS accuracy, staff equipment literacy rate)
Taxes owed
Return on investment
Sales and costs - Actual versus budget as a percentage
Stocktaking discrepancies per department
Total (short term) accounts due
Total accounts payable
SALES AND MARKETING PLUS FUNCTION MANAGEMENT
Booking forecast - Future x weeks / months, special holidays
Number of function inquiries, percentage of campaign cost against functions
Marketing and advertising costs and cost per response as ratio
Press mentions
Campaign response rate
Sales inquiry conversion rate - The number of inquiries that turn into actual sales
Sales per head (across all areas)
Repeat visits, especially by top 100 or 200 customers
Staffing
Average hourly pay
Average length of employment
Profit/markup on function labor charge-out (caterers)
Labor turnover (number of new staff in any one week or month)
Sick days taken (as a percentage of total available working days)
Total labor cost percentage
Total labor hours per each section
Wage cost percentage - Wage costs as a percentage of sales
Waste Management and Remediation Services
Electronics) Sub-sector indicators - For printed circuit board (PCB), semiconductor, and cathode ray tube (CRT) manufacture
Chemical emission rate per facility
Compliance with water license conditions
Cost per load
Demolition recovery index and new build recovery index
Discharge efficiency
Energy indicators
Facility saturation rate
Percentage of hazardous material over total waste
Percentage of reusable/recycled material
Percentage of sample failure
Percentage of total waste diverted from landfill and other disposal options
Percentage of waste recycled off site
Percentage of wastewater treatment works meeting license conditions
Percentage of waste reused off site
Percentage of waste reused on site
Pollution indicators (emissions to air, effluent, solid waste)
Potable water consumption
Renewable energy consumption
Segregation rate
Site level indicators of resource efficiency
Surface runoff efficiency
Total recycled content by material value
Transport time efficiency
Waste cost per carriageway or pipeline length
Waste cost per project as percentage
Waste cost per project footprint
Waste cost per square meter floor area
Waste generation (tonnage) per project
Waste generation (tonnage) per square meter/ foot
Waste generation (volume) per project
Waste generation (volume) per square meter/ foot
Wastewater discharge
Emissions to air
Acid rain, eutrophication, and smog precursors
Dust and particles
Greenhouse gases
Metal emissions to air
Ozone depleting substances
Volatile organic compounds
Emissions to water
Nutrients and organic pollutants
Metal emissions to water
Emissions to air
Acids and organic pollutants
Metal emissions to land
Pesticides and fertilizers
Radioactive waste
Waste (landfill, incinerated, and recycled)
Agriculture, Forestry, Fishing, and Huntin2 Industry
21-day weight per litter
Amount of trees planted versus actual planted by percentage
Average number of harvest per year
Carbon dioxide per square mile
Cost per wildfire
Customer satisfaction level (CSAT)
Domestic demands versus supply
Dust and particles per square mile
Establishment's occupancy
Establishment's rate
Export rate
Import rate
Increase or decrease in number of complaints over time
Increase or decrease in number of hunting applications over time
Industry employment source and turnover rate
Industry gross product
Industry revenue
Landslides caused by wildfires
Number of wildfires
Percentage of increase in rod license
Percentage of increase or decrease in fish count (in relation to ecological effects)
Percentage of hazards minimized within x hours of notification
Percentage of live birth (per each animal group)
Percentage of natural resources accessed
Percentage of natural resources sustained
Total wages
Wean per litter
Weight per litter at birth
Arts, Entertainment, and Recreation
INSTITUTIONAL KPIS
Album publication over total submission
Average ticket price per season
Cost per broadcast hour
Cost per performing night
Cost per production hour
Cost per viewer/ listener
Donation percentage of total revenue
Donation increase / decrease over time
Employer satisfaction rate
Employment rate
Gallery showing over total submission
Graduation rate
Increase/decrease number of performance nights per year
Market share
Net surplus percentage
Number of kindergarten through 12th grade school tours per year
Occupancy rate
Percentage of broadcast hours by genre
Percentage of national content (broadcasting organizations)
Percentage of overhead against total expenditure
Profit percentage
Ratio of amateur versus professional performers
Revenue
Special/guest appearance cost per revenue
Television show rating
Utilization rate (recording studio, concert hall, art studio)
Viewers/listeners for each medium as a percentage of total population
Personal KPIs
Number of awards
Number of gallery showings per year
Number of public appearances per year
Number of published recordings
Number of renowned awards (e.g., Billboard, Oscar, etc.)
Ratio of won competitions over participated
Construction
Number of accidents
Number of accidents per supplier
Actual working days versus available working days
Cash balance - Actual versus baseline
Change orders - Clients
Change orders - Project manager
Client satisfaction - Client-specified criteria
Client satisfaction product - Standard criteria
Client satisfaction service - Standard criteria
Cost for construction
Cost predictability - Construction
Cost predictability - Construction (client change orders)
Cost predictability; Construction (project leader change orders)
Cost predictability - Design
Cost predictability - Design and construction cost to rectify defects
Customer satisfaction level
Day to day project completion ratio - Actual versus baseline
Fatalities
Interest cover (company)
Labor cost - Actual versus baseline
Labor cost over project timeline
Liability ratio (over asset) on current versus completion comparison
Number of defects
Outstanding money (project)
Percentage of equipment downtime
Percentage of labor downtime
Percentage of backlogs over project timeline
Percentage of unapproved change orders
Productivity (company)
Profit margin - Actual versus baseline profit margin over project timeline
Profit predictability (project)
Profitability (company)
Quality issues at available for use
Quality issues at end of defect rectification period
Ratio of value added (company)
Repeat business (company)
Reportable accidents (including fatalities)
Reportable accidents (non-fatal)
Return on capital employed (company)
Return on investment (client)
Return on value added (company)
Time for construction
Time predictability - Construction
Time predictability - Construction (client change orders)
Time predictability - Construction (project leader change orders)
Time predictability - Design
Time predictability - Design and construction
Time taken to reach final account (project)
Time to rectify defects
Educational Services
Administrative expenses as a percentage of educational and general expenditures
Admission test scores for entering students
Annual student survey - Two-year comparison in five key areas
Attrition rate of online courses
Average course experience
Average daily attendance
Average daily participation percentages
Average endowment distribution by student
Average net academic cost and average percent discount
Average percentage consistently absent
Average student credit hours taught by tenure/ tenure track faculty by college
Average tenure or tenure track faculty salaries by college compared to peer benchmarks
Average undergraduate student credit load
Average student free application for federal student aid (FASFA) unmet financial need
Average graduating student debt
Choice into district - Number of students
Choice out of district - Number of students
Class attendance
Classroom and laboratory utilization
Comparison of most recent graduating high school classes to diversity of new 18-and 19-year-old students who enroll in the following fall term
Continuation rates of college students
Cost per graduate
Cost per meal (CPM)
Degrees awarded - Baccalaureate, masters, doctoral
Development expenditures as a percentage of total external income
Distance learning enrollment
Distance learning number of degree programs
Dollar value of restricted research expenditures
Dollar value of total external research grant applications and expenditures
Endowment value per student
Expenditures per student
Fewer students classified as needing special education services
Four-year graduation rate for community college transfer students with 30+ hours
Freshman retention rate by ethnic group and by financial aid category
Fund balance at x % of yearly expenditures
Graduate/ professional degrees in high demand fields
Home school students registered - Number of students
Increase of percentage of school-age students with disabilities participating in occupational education program
Increase of percentage of school-age students with disabilities receiving special education services in general class placements
Increase of percentage of preschool students with disabilities receiving special education services in settings that include nondisabled children
Increase of percentage of school-age students with disabilities receiving services in general education buildings
Institutional debt per student
Instructional expenses per student
International student load
International student headcount and percentage of FTE
Licensure exam pass rates
Licensure exam pass rates in program x
Master's-level five-year and doctoral ten-year graduation rate
Masters and doctoral graduates employed in state x compared to other state x graduates
National ranking of baccalaureate, masters, and doctoral degrees awarded to minority students
Nationally ranked programs
NCAA team sports athletics total wins
Non-instructional FTE per student FTSE, or non-instructional FTE to instructional FTE ratio
NSSE results in quality of student advising, entire educational experience, would attend again, overall satisfaction
Number of degrees awarded
Number of students per teacher
Number of total budgeted tenure/ tenure track faculty positions
Number of vocational degrees awarded
Percentage of academic staff with a doctorate
Percentage of full-time faculty who are women, are ethnic minorities, or have terminal degrees
Percentage of course requests satisfied by semester
Percentage of degree-seeking new transfers (of total enrollment)
Percentage of first year class in top 10% and top 25% of HS graduating class
Percentage of first year students requiring developmental education and successful completion percentage of developmental education
Percentage of graduating seniors from area high schools from most recent academic year who enroll in following fall term
Percentage of new students ages 18 to 19 who need developmental education based on their test scores
Percentage of tenure/tenure track faculty holding grants by college
Percentage of total positions endowed
Percentage of undergraduates receiving baccalaureate degrees with eight SCH or fewer above minimum requirement, number qualifying for state mandated rebate, and number requesting and receiving their rebate
Postdoctoral fellows
Program expenditures as a percentage of budgets Research rankings national and state Retention rates of students in vocational courses SCH taught by tenure/tenure track faculty vs. non-tenure/tenure track faculty by college
Six-year graduation rate and combined graduation/persistence rate
Student services expenditures per student FTSE
Students per faculty
Successful course completion
System-wide reduction in energy use over ten years
Technology transfer - new invention disclosures, patents issues, licenses and options executed, gross revenue from intellectual property
Time to a baccalaureate degree by area of study
Total budgeted endowed professorships and chairs
Total degree seeking new transfers
Total external gifts by alumni - Number and amount
Total external gifts by corporations - Number and amount
Total external gifts by foundations - Number and amount
Total external gifts by individuals - Number and amount
Total new transfer students
Total operating expenditures per student FTE
Total professorships and chairs positions filled
Total state appropriations per FTE student and tuition and fees per FTE student in constant dollars
Total state appropriations per FTE student compared to peers
Total stipend support for graduate students
Transportation costs per pupil
Tuition and mandatory fees compared to peers
Undergraduate classes with fewer than 30 students
Undergraduate degrees in high demand fields
Undergraduate financial aid awards
Undergraduates per professional academic advisor by college
Unrestricted reserves as percentage of operating budget
University students studying abroad headcount
Yellow bus on-time performance
Finance and Insurance
Finance
Accounts payable
Asset turnover rate
Average sum deposited in new deposit accounts
Average value of past due loans
Common stock equity
Cost per hour per lawyer (in-house)
Cycle time to perform periodic close
Debt-to-asset ratio
Direct costs
Earnings per share (EPS)
EBIT
EBITDA
Economic value added
Enterprise value/takeover value
Gross margin on managed assets
Interest expense
Interest on net worth
Invoicing processing costs
Labor and management cost
Labor and management earnings
Legal staff per size of revenue
Long-term debt
Marginal costs
Net interest margin
Net new money
Net profit
Net profit margin
Number of budget deviations
Number of past due loans
Operating income
Operating margin
Operating profit margin
Other current liabilities
Other noncurrent liabilities
Percentage of accuracy of periodic financial reports
Percentage of effectiveness in payables management
Percentage of budget deviation relative to total budget
Percentage of financial reports issued on time
Percentage of invoices under query
Percentage of legal budget spent outside
Preferred stock equity
Product turnover ratio
Profit
Profit loss due to theft
Profit margin
Profit per product
Rate of return on assets
Rate of return on equity
Return on assets
Return on investment (ROI)
Return to equity
Revenue per employee
Sales per share
Same store sales
Selling general and administrative (SG&A) expenses
Shares outstanding
Sharpe ratio
Short-term debt
Sortino ratio
Tier 1 capital
Total assets
Total current liabilities
Total equity
Total legal spending as a percentage of revenue
Total liabilities
Total of uninvested funds
Total quantity of new deposit accounts
Total sum deposited in new deposit accounts
Total value of past due loans
Variable costs
Insurance
Average insurance policy size
Claims
Combined cost and claims ratio
Combined ratio
Current premium versus loss
Earned premium
Expense ratio
Expenses
Exposure
Loss adjustment expenses (LAE)
Loss ratio
Number of days open of insurance claims
Number of new insurance policies
Previous premium versus loss
Underwriting speed of insurances
Written premium
Health Care and Social Assistance
Accounts receivable
Accounts payable and accrued expenses
Admissions in-patient
Average length of stay (ALOS)
Average length of stay (ALOS) for top ten diagnoses
Assets in current period
Assets in prior period
Average age of plant
Average age of workforce
Average daily and monthly census
Average hourly rate
Average length of stay
Average payment period (days)
Average time to fill positions
Backorder percentage
Bad debt as percentage of net revenue
Bottleneck areas
Break even
Capital expenditure growth rate
Case mix index
Cash and equivalents
Cash collected versus target
Cash on hand (days)
Communication effectiveness
Contract negotiation schedule
Cost per discharge
Current asset turnover
Current ratio
Days in accounts receivable
Debt service coverage ratio
Depredation funds
Depreciation rate
Discharge process time
Discharges in-patient
Discounts trends, revenue, and margin by payer class
Due to third parties
Education funds
Emergency visits outpatient
Encounters outpatient
Equity financing
Errors related to procedure/treatment or test
Events, number of events by type and department
Expenses per physician FTE
Fixed asset turnover
Free operating cash flow to assets
Free operating cash flow to revenue
FTE per occupied bed
FTEs per adjusted occupied bed
Growth rate on equity
Hazardous materials usage
Informed about delays
Inventory ratio
Investments at market value
Long-term investments
Maintained bed occupancy
Mean wait time in emergency department (ED) for hospital bed
Medication errors, number of errors per 1,000 treatments
Medication errors, number of errors per month/year
Month to date (MTD) bad debt
MTD cash collected
MTD revenue
Net assets
Net income to patient revenue
Net revenue
Non-operating gains
Number of new hires per day
Nurse turnover rate
Nurse vacancy rate
Nurses attention to needs
Operating revenues
Other liabilities
Outside labor as a percentage of total
Over or under consumption of service lines by payer types
Overtime costs
Paid time off costs at business unit level
Paid time off costs at department level
Patient accounts receivable
Patient care hours
Patient complaint rate
Patient satisfaction
Patient wait times, by process step
Patient/staff ratios
Patients who leave without being seen (by day, by time)
Percentage of capital expenses
Percentage of cash flow to total debt
Percentage of cash flow to total liabilities
Percentage of charitable revenue
Percentage of debt to capitalization
Percentage of fixed asset financing
Percentage of in-patient capitated revenue
Percentage of in-patient commercial revenue
Percentage of in-patient HMO revenue
Percentage of in-patient revenue
Percentage of in-patient self-pay revenue
Percentage of Medicaid revenue
Percentage of operating margin
Percentage of outpatient Medicare revenue
Percentage of outpatient revenue
Percentage of part-time FTEs of total FTEs
Percentage of voluntary staff turnover
Physician FTE
Physician productivity (relative value units)
Purchase order (PO) quantity ordered by department
Property, plant, and equipment
Readmission rates
Replacement viability
Reported income index
Reserve levels
Return on equity
Return to vendor
Revenue by contract type
Revenue per physician FTE
Risk-adjusted mortality
Salaries and benefits
Satisfaction with physical examination
Satisfaction with physician
Service line utilization and trends by payer type
Service provision
Short-term investments
Skill levels
Source of hires versus cost
Staff turnover
Staff turnover by job code
Staff turnover by location
Staffing cost trend
Staffing-related quality indicators
Supplies and services
Surgical cases in-patient
Surgical cases out-patient
Times interest earned
Total admissions
Total cash and investments
Total compensation per FTE
Total discharge
Total income
Total margin
Total operating expenses
Total paid time off of FTEs
Total PO dollar amount
Total revenue per FTE
Total salary per FTE
Total travel distance
Total turnover per manager
Total turnover per tenure
Total unrestricted funds
Turnover of clinical and non-clinical staff
Uncompensated care
Unit efficiency
Unrealized gains
Vacancy rate
Weekly payroll
Working capital absorption
Working capital for current accounting period
Information
Annual cost per reading
Average cost per article
Average cost per subscription
Average dollars per email sent or delivered
Average order size
Average quarter-hour audience
Average revenue per subscription
Average time spent listening per user (day/week/month/year)
Bounce rate
Click to open rate (number of unique clicks/ number of unique opens)
Click-through rate
Click-through rate (CTR)
Conversion rate
Conversion rate (number of actions/unique click-throughs)
Conversion rates
Cost per consumed (by viewers/listeners) hour
Cost per customer
Cost per lead, prospect, or referral
Cost per viewer/listener
Cost per visitor
Cost per action (CPA)
Cumulative audience sessions
Delivery rate (emails sent, bounces)
Gross ratings points
Life cycle cost per reading
Local content as a percentage of all content
Net subscribers (number of subscribers plus new subscribers) -(bounces + unsubscribes)
Number of broadcast hours per day/week/month/year
Number of or percentage of spam complaints
Number of orders, transactions, downloads, or actions
Open rate
Output per employee (unique first run broadcast hours by employee for each medium)
Pay per click (PPC)
Pay per lead (PPL)
Pay per sale (PPS)
Percentage of broadcast hours by genre (news/sports/entertainment, etc.)
Percentage of overhead (non-direct operating costs) against total expenditure
Percentage of orders, transactions, downloads, or actions of emails sent or delivered
Percentage unique clicks on a specific recurring Iink(s)
Referral rate ("send-to-a-friend")
Site stickiness (number of pages visited per visit)
Subscriber retention (number of subscribers, bounces, unsubscribes/number of subscribers)
Total cost per subscription
Total listener hours (day/week/month/year)
Total revenue
Total revenue per subscription
Unique visitors (total number of unique visitors per day/week/month)
Unsubscribe rate
Utilization of production resources
Value per visitor
Viewers/listeners for each medium as a percentage of total population
Website actions (number of visits to a specific web page or pages)
Website traffic (total page impressions per day/week/month)
Management of Companies and Enterprises
Capital ratio
Cash position by currency
Cash-to-assets ratio
Cash-to-liabilities ratio
Cash-to-working capital ratio
Cash utilization
Change in residual risk levels
Comparative revenues across offices/subsidiaries/departments
Consolidated payments
Consolidated profits
Consolidated receivables
Consolidated revenues
Consolidated settlements
Cost of equity
Cost to hire management talent
Cost-to-income ratio - By business
Cost-to-income ratio - Consolidated
Days in accounts payable
Days in accounts receivable
Earnings per share
Economic profit
Effectiveness of the risk management practices that are controlling material risks
Employee engagement (as measured through survey participation)
Employee movement (such as time in position, transfers, and promotions)
External funds under management
Holding company cash flow
Internal rare of return on new business information technology (IT) spending per employee
Level of inherent risk
Long-term debt
Net profit growth
New business profit
Operating profit on long-term investments
Profit diversification
Return on equity
Revenue mix
Short-term debt
Time to hire management talent
Total cash deposits
Manufacturing
Asset utilization
Availability
Avoided cost
Capacity utilization
Comparative analytics for products, plants, divisions, companies
Compliance rates (for government regulations, etc.)
Customer complaints
Customer satisfaction
Cycle time
Demand forecasting
Faults detected prior to failure
First aid visits
First time through
Forecasts of production quantities, etc.
Increase/decrease in plant downtime
Industry benchmark performance
Integration capabilities
Interaction level Inventory
Job, product costing
Labor as a percentage of cost
Labor usage, costs-direct and indirect
Machine modules reuse
Maintenance cost per unit
Manufacturing cost per unit
Material costing, usage
Mean time between failure (MTBF)
Mean time to repair
Number of production assignments completed in time
On-time orders
On-time shipping
Open orders
Overall equipment effectiveness
Overall production efficiency of a department, plant, or division
Overtime as a percentage of total hours
Percentage decrease in inventory carrying costs
Percentage decrease in production-to-market lead-time
Percentage decrease in scrap and rework costs
Percentage decrease in standard production hours
Percentage increase in productivity
Percentage increase in revenues
Percentage material cost reduction
Percentage reduction in defect rates
Percentage reduction in downtime
Percentage reduction in inventory levels
Percentage reduction in manufacturing lead times
Percentage savings in costs
Percentage savings in inventory costs
Percentage savings in labor costs
Percentage savings in transportation costs
Planned work to total work ratio
Predictive maintenance monitoring (maintenance events per cycle)
Process capability
Productivity
Quality improvement (first-pass yield)
Quality tracking-six sigma
Reduced time to productivity
Reduction in penalties
Savings in inventory carrying costs
Scheduled production
Spend analytics
Storehouse stock effectiveness
Supplier trending
Time from order to shipment
Time on floor to be packed
Unplanned capacity expenditure
Unused capacity expenditures
Utilization
Waste ration reduction
Work-in-process (WIP)
Mining
Average bucket weight
Average fuel use per machine
Average loading time
Average number of dumps per hour/day/week/month
Average number of loads per hour/day/week/month
Average payload
Average swing time
Cash operating costs per barrel of oil equivalent (BOE)
Change time (time between cycles)
Cycle distance
Cycle time
Degree of purity and physical characteristics
Dilution of ore
Dump time
Efficiency of metallurgical recovery
Empty stop time
Empty travel distance
Empty travel time
Exploration costs
Finding and development costs
Flitch
Fuel (e.g. , gallons/hour)
Gross refining margin
Incident rate (accidents, etc.) per x hours
Lifting costs
Loaded stop time
Loaded travel distance
Loaded travel time
Loading time
Lost time incident frequency rate
Number of equipment failures per day/week/month/year)
Number of holes drilled per day/week/month/year
Oil reserves
Payload
Payload correction (difference between raw and corrected payload)
Percent (metal, etc.) in ore
Percentage uptime (of equipment, plant, etc.)
Product into shed
Production cost per barrel
Production rate-bank cubic meter (BCM)/ hour (cubic meters of material moved per hour)
Raw material substitution rate (percentage)
Raw payload
Reserve and resource replacement (percentage)
Tons of ore feed
Tons per hour
Tons per load
Total minutes lost per shift due to breaks
Unit variable costs
Utilization
Waste per ton
Waste recycling (e.g., tons per time unit)
Waste volume
Other Services (except public administration)
Average employee utilization
Average equipment utilization
Average number of days required to repair the item
Average number of no· shows per week/month
Average number of training hours per employee
Average repair cost
Average repair time
Average revenue per service delivered
Cash collected
Collections
Average training cost per employee
Client retention rate
Customer turnover rate
Daily goals
Employee turnover rate
Gross profit on pans/material sold
Idle time
Material cost per service hour sold
Mean service request completion time
Time to dose distribution (by time buckets)
Net profit as a percentage of labor sold
Number of apprentices and organized members certified
Number of apprentices and organized members needed to meet requirements
Number of open service requests
Number of prospective clients converted to clients
Number of service requests resolved during the period
Number of training courses conducted per month/quarter/year
Service level details
Percentage of members participating in approved programs
Percentage of total members participating in meetings
Period service renewal rate
Period service renewals booked value/period service renewals value
Period service renewals value
Repair order mean time to repair
Repair order past due percentage
Sales per employee
Sales per estimator
Sales per production square foot
Sales per production technician
Service booked to renewal ratio
Service contracts activated new business value
Service Contracts activated renewals value
Service contracts expired value
Service contracts terminated billed value
Service contracts terminated remaining value
Service department throughput (per day/week/month)
Service level
Service renewal past due percentage
Service renewals booked value
Service renewals forecast
Service renewals uplift
Service request backlog
Service request closed activity
Service request escalated backlog percentage
Service request reopened activity
Service request unassigned backlog percentage
Target membership growth
Total pans/material cost as a percentage of total sales
Unresolved escalated backlog percentage
Unresolved service request backlog
Unresolved unassigned backlog percentage
Weekly team targets
Professional, Scientific, and Technical Services
Annual billable utilization percentage
Availability
Availability (excluding planned downtime)
Average percentage of CPU utilization
Average percentage of memory utilization
Average hourly fee
Average number of virtual images per administrator
Cost of managing processes
Cost of service delivery
Deviation of planned budget for SLA
Downtime
Mean time to repair (MTTR)
Mean time between failure (MTBF)
Number of defects found over period of time
Number of outstanding actions of last SLA review
Percentage of application development work outsourced
Percentage of bugs found in-house
Percentage of consultants generating revenue
Percentage of consulting hours that generate revenue
Percentage of email spam messages stopped/detected
Percentage of outage due to changes (planned unavailability)
Percentage of outage due to incidents (unplanned unavailability)
Percentage of service requests resolved within an agreed-on period of time
Percentage of systems covered by antivirus/antispyware software
Percentage of systems with latest antivirus/antispyware signatures
Percentage of time lost redeveloping applications as a result of source code loss
Percentage of time sheets in need of correction/validation
Percentage of unit tests covering software code
Percentage of user requested features
Profit per project
Quality assurance personnel as percentage of the number of application developers
Software development quality
System usability scale
Time ratio for design to development work
Time-to-market of changes to existing products/services
Total service delivery penalties paid
Unit costs of IT services
Workforce turnover rate
Public Administration
Economic Development
Amount of new retail square footage
Average number of business days before reported graffiti is removed
Cost per animal sterilized
Cost per person trained in workforce development
Cost per sheltered animal
Cost per youth placed in summer youth employment jobs
Development of county-wide infrastructure, land supply, and affordable housing plan within one year, plan implementation and schedule adherence thereafter
Dropout rate of high school students
Health and human services
Housing affordability index/percentage of households that can afford a median-priced home
Net loss of agricultural or environmentally sensitive areas
Number of affordable mortgages financed for eligible low and moderate income families
Number of childcare facilities in areas of need
Number of childcare facilities with national accreditation
Number of economic development inquiries received
Number of emerging technology projects
Number of existing and startup businesses and agencies trained by the city or county per year that remain in business after two years
Number of jobs created in the community from economic and community development projects
Number of loans to low and moderate income persons closed per year
Number of low-income infants, toddlers, and preschoolers participating in early childhood development services (versus waiting list)
Number of new assisted living units in public housing within two years
Number of new businesses related to incentives/coordinated efforts to promote growth in targeted industries
Number of new incubated businesses that survive at least two years
Number of special projects completed
Number of successful placements of training program participants in employment within three years
Number of volunteer hours
Number of youth participating in after-school / gap-time programming
Number of youths participating in employment and entrepreneurship programs within two years
Per capita income
Percentage annual increase in new dollars generated for economic development programs
Percentage increase in graduation rare
Percentage of businesses trained and subsequently receiving funding within two years
Percentage of children with insurance
Percentage of people with disabilities satisfied or very satisfied with service access within three years
Percentage of residents satisfied with community involvement process with economic development
Percentage of residents with increased access to primary and specialty medical care
Percentage of sheltered animals adopted
Percentage of youth with improved academic performance
Percentage increase in the number of affordable and special needs housing
Percentage of businesses satisfied or very satisfied with the city/county's business processes
Percentage of customers of the health and human services area satisfied or very satisfied with service delivery and customer care
Percentage of participants who report they learned something that will help them start a business
Percentage of survey respondents earning less than $25,000 per year that rate the city/county's health and human services as good or very good
Percentage of survey respondents that agree the city or county government effectively develops low-income/poor areas
Percentage of users of health and human services satisfied or very satisfied with transit access to health care
Reduced percentage rate of uninsured in the city/county
Sick leave hours used per 1,000 hours
Total infant mortality rate per 1,000 live births
Total mortality rate (all causes) per 100,000
Unemployment rateNeighborhood and Unincorporated Area Municipal Services
Cost per document released
Net loss of agricultural designated lands outside the urban development boundary (UDB) or environmentally sensitive lands
Number of infill development and infill housing units and infill redevelopment projects per year (completed)
Number of renters assisted
Percentage of lease payments that will be on time
Percentage of tree canopy increase
Percentage of general/nuisance complaints responded to within 48 hours
Percentage of nuisance incidents remediated within predefined timeframes
Percentage of residents and businesses aware of critical knowledge factors of code compliance
Percentage of residents satisfied with information delivery systems
Percentage of roadways and rights-of-way cleaned and well maintained
Percentage of survey respondents that agree the city or county employees that helped them went the extra mile to get their issue heard and resolved
Percentage of survey respondents that rate flooding as a minor or major problem in their neighborhood
Percentage of survey respondents that rate the development and land use/zoning in their neighborhood as good or very good
Percentage of survey respondents that rate the drinking water quality and sewer service as good or very good
Percentage of survey respondents that rate the quality of roadways and road signs in city or county as good or very good
Percentage of survey respondents that were satisfied with their last contact with city or county personnel
Secret shopper rating for employee customer service
Total square feet of facilitiesPublic Safety
Average fire rescue response time from time dispatch receives life-threatening call from 911 and/ or percentage of total fire calls with a response time under eight minutes from call entry to arrival and/or emergency services average response time from public safety answering point (PSAP) to arrival
Cost per park safety enforcement action on park land
Development and implementation of a comprehensive plan for homeland security
Development of a comprehensive plan for homeland security
Increase in number of licensed pets over next three years
Increase number of public emergency shelters by 10% in three years
Number of abandoned vehicles investigated
Number of collisions related to pursuits
Number of first responders trained and equipped for an emergency event
Number of patrol hours in neighborhoods
Number of pedestrian/bicycle collisions per 100,000 population
Number of requests for special operations support
Number of service call responses annually
Percentage increase in number of volunteers over the next three years
Percentage increase in use of non-lethal technology over next three years
Percentage of citizens that state they feel safe in parks and recreation facilities
Percentage reduction in drug-related incidents
Percentage reduction in juvenile crime rates
Percentage reduction in non-emergency calls into the 911 system
Percentage of survey respondents who generally find police officers and traffic enforcement officers to be friendly and approachable safety services
Percentage of survey respondents that rate crime in their neighborhood as a minor or major problem
Percentage reduction in property loss rate
Police emergency average response time (minutes)
Rate of reinstitutionalization of offenders processed through the Juvenile Evaluation Center
Rate of traffic fatalities per 100,000 populationRecreation and Culture
Average cost per daily servicing acre
Average safety rating for pools
Cost per estimated arts center services participant hour
Cost per estimated museum participant hour
Cost per participant hour in senior services
Cost per public event
Increase in the number of collaborative programs and participants with educational institutions
Number of acres of natural areas restored and number of acres maintained
Number of adult sports teams
Number of attendees at recreational, cultural, and library facilities, programs and services
Number of cultural, recreational, and libraries collaboration projects per year
Number of cultural, recreational, and library programs available for the elderly and people with disabilities
Number of developed park acreage
Number of estimated arts center services participant hours
Number of estimated participant hours in after-school programs
Number of meals served to seniors
Number of public art contracts completed
Number of residents satisfied or very satisfied with availability of open or green spaces
Number of residents satisfied or very satisfied with availability of facilities within five years
Park acres per capita
Percentage of free programs offered
Percentage of library district residents within four miles (or 25 minutes) of a library
Percentage of organizations and artists satisfied or very satisfied with the city or county gram application process
Percentage of participants satisfied or very satisfied with availability of quality lifelong learning programs in three years
Percentage of survey respondents that rate the city or county's library services as good or very good
Percentage of survey respondents that rate the city or county's recreational and cultural activities as good or very good
Quality rating of residents and visitors for cultural, recreational, and library facilities and places
Recreation and culture dollars available through all sources of funding, including existing and new sources
Resident ratings of the appearance of recreational, cultural, and library facilities
Resident ratings of the range of parks and recreation activities
Total audience served through public eventsTransportation
Achievement of all major milestones timelines in the city or county's transportation plan
Annual percentage change of parking operations expense
Average commute times to work in minutes
Average dollar value per central purchasing office purchase order
Average number of days between invoice date and date of check disbursement
Bond ratings
Calendar days from requisition to purchase order
Cost of government - Dollars per capita and per capita by category
Daily bus and rail boardings
Dollar amount of purchases made that meet sustainability guidelines
Dollar cost per accounts payable transaction
Enabling strategies - Budgets and finance
Implementation of 24-hour rail and bus operations
Improved national customer satisfaction ranking for the airport to one of the top 20-ranked airports within two years
Increase average work-trip vehicle occupancy from an estimated 1.1 passengers per vehicle to 1.15 passengers per vehicle
Increase in compliance with local tax collection by 5% over next five years
Increase in percentage of public transit trips taken
Increase in number of visitors to county transit websites
Increase the customer satisfaction ranking for the seaport by 1.5 percent by year x
National customer satisfaction ranking the airport among the top ten airports for passenger satisfaction by year x
Negotiated contract savings (dollars saved)
Net parking income/loss
Number (and percentage) of facilities meeting regulatory requirements
Number of audits and special projects completed
Number of parking tickets issued
Number of payment transactions processed for departments
Number of projects managed
Number of purchases made city/countywide by central purchasing office
Number of residents satisfied or very satisfied with the implementation of the city/county's transportation plan
Percentage of audit recommendations "concurred with" by management
Percentage of cash reserves
Percentage of strategic plans outcomes supported by business plans
Percentage of traffic signals synchronized and optimized
Percentage of vendor solicitations successfully awarded without delay due to rebids or protests
Percentage of community satisfied with value of city or county's services for tax dollars paid
Percentage of employees rating the city or county or state as a good place to work
Percentage of internal users satisfied with procurement timeliness quality, and overall service
Percentage of survey respondents that rate the cleanliness of buses and train cars as good or very good
Percentage of survey respondents that rate the congestion on the roadways in their neighborhood as a minor or major problem
Percentage of survey respondents that rate the convenience of the city or county bus routes as good or very good
Percentage of survey respondents that rate the ease of transportation to and from the airport and seaport as good or very good
Planned frequency of transit service during peak and non-peak hours
Rate of schedule adherence for bus and rail service
Receiving Government Finance Officers Association (GFOA) distinguished budget award
Total number of aviation passengersEnabling Strategies Government Operations
Cost per page view on the city or county website
Dollars saved through IT investments
Electronic access to services and information, and percentage of survey respondents that agree that it is easy to find what they need or want on the city or county website
Fleet costs (acquisition, operating, resale value) within prescribed industry standards and percentage of department users satisfied with quality and timeliness of fleet management services
Increase number of employees rating the city or county as a good place to work
Number of page views on the city or county website per capita
Number of planned media events (includes news conferences)
One hundred percent of financial reports filed timely and accurately in compliance with the law
Percentage of city or county employees aware of their component of performance targets
Percentage of city or county employees aware of their importance to city or county’s values and priorities
Percentage of IT projects completed on time, within budget
Percentage of IT routine problems solved within 24 hours
Percentage of (facility) projects completed within budget and on time
Percentage of accuracy between votes cast and votes reported
Percentage of customers familiar with city or county sources of information
Percentage of internal customers and residents satisfied with aesthetics of city or county facilities
Percentage of residents with a positive image of city or county government
Percentage of users (residents, visitors, employees, etc.) satisfied with city or county services
Reduced staff turnover
Satisfaction ratings from service delivery departments
Value of corporate-initiated media coverage
Voter satisfaction with process
Real Estate and Rental and Leasing
Realtor Website
Conversation rate (i.e., take rate) - Number of conversations over number of website visits
Top conversion page exit - The page where website visitors change their minds and exit your website.
Traffic source percentage - Website visits referred byReal Estate Office
Advertising and promotion
Average commission per sale
Average commission per salesperson
Commission margin
Net profit
Office cost (telephone, fax, and other office cost)
Rent cost of premises
Sold homes per available inventory ratio
Total income
Wages and salaries (including commissions and vehicle allowances)
Year-to-year variance on average sold price
Year-to-year variance on dollar volume of sold listings
Year-to-year variance on sold average dollar per square footCommercial Property Management
Annual return on investment in percentage
Construction/purchaser rate - New constructed or purchased units over time
Cost per square foot
Equity value growth in percentage
Lease events coverage ratio - Number of lease inquiries over number of available units
Management efficiency - Number of leased spaces over number of staff
Market share growth
Monthly return on investment as percentage
Occupancy cost - Cost per occupied unit
Operation cost to rent income ratio
Percentage of rent collected
Price to income as percentage
Profitability per square foot
Real estate demand growth - Market rental demands
Rented space usage quality - Average number of tenant visits over rented space
Renting cost - Renting cost per square foot
Renting return on investment - Rent income over cost
Revenue per square foot
Risk metrics as percentage
Total property management income per property manager
Usage efficiency - Available renting square feet over number of staff
Utilization (vacancy) rate - Rented square feet over total square feet, or rented units over total unitsReal Estate Investor
Average gross multiplier for portfolio
Cost per square foot to value per square foot ratio
Equity to value ratio
Gross multiplier per commercial property
LTV (loan to value) ratio per property
Mortgage rate index
Overall LTV (loan to value) ratio for portfolio
Price per square foot to value per square foot ratio
Profitability per square foot
Property value growth (market trend)
Purchase price-to-appraisal value ratio
Rental value growth rate ROI (return on investment)
Retail Trade
Product Sales
Average inventory
Cost of goods sold
Gross profit budget percentage
Sales budget percentage
Discount
Gross profit
Gross profit and prognostics
Gross profit and prognostics percentage
Gross profit budget
Gross profit campaign
Gross profit percentage KPI
Gross profit prognostics
Gross profit prognostics percentage
Gross profit standard
Gross profit year to date
Number of stores
Product quantity
Sales
Sales and prognostics
Sales campaign
Sales growth period
Sales growth year
Sales growth year by week
Sales prognostics
Sales standard
Sales trend percentage KPI
Sales value-added tax (VAT)
Sales view
Sales view year-to-date
Share prognostics
Time rangeFinance and Accounting
Accounts payable turnover
Accounts receivable turnover days
Acid test ratio
Administrative cost percentage
Break-even (dollars)
Cash conversion cycle
Contribution margin
Cost of goods
Cost of goods sold
Current ratio
Ending inventory at retail
Gross margin
Gross margin return on investment
Initial mark-up
Interest cost percentage
Inventory turnover
Maintained mark-up (dollars)
Margin percentage
Mark-up percentage
Net receipts
Net sales
Retail price
Return on capital invested
Sales per square foot
Stock turnover days
Total asset sales ratio
TurnoverSalary
Real absence hours
Real absence share
Real GPWH
Real overtime hours
Real overtime share
Real TWH
Real working hours
Salary
Salary amount
Salary amount exchange currency
Salary hours
Salary turnover shareSalary Targets
Real absence hours
Real GP work hours
Real total work hours
Salary absence percentage
Salary GP work hour
Salary overtime percentage
Salary target absence percentage
Salary target GP work hour
Salary target overtime percentage
Salary target turnover percentage
Salary target work hour
Salary turnover percentageHourly Sales
Customers per hour
Discount
Gross profit
Items
Margin per customer
Number of customers
Sales growth year
Sales growth year percentage
Sales last year
Sales per customer
Sales trend percentage
Sales view
Total number of storesBudget Sales
Budget gross profit
Budget number of customers
Budget sales
Customers
Discount
Gross profit
Items
Sales
Sales exchange currency
Sales VATPayment With Point-Of-Sale (POS) Statistics
Amount
Amount exchange currency
Items
Number of customers
Number of items
Refund amount
Refund count
Sales income VAT
Time range
Transaction cancel amount
Transaction cancel count
Transaction cancel percentage
Void amount
Void count
Void percentage
Zero sale countHourly Product Sales
Gross profit percentage
Item discount
Item gross profit
Item quantity
Item sales
Item sales exchange currency
Item sales VAT
Items sold
Transportation and Warehousing
Annualized inventory turns
Annualized cost of goods sold (COGS)/average daily inventory value
Backlog value
Value of open, not yet fulfilled, booked order lines
Book to fulfill ratio
Booked order value/fulfilled value
Book to ship days
Average of shipped date - Firm date (booked date used if no firmed date)
Booked order value
Booked order line value (not including returns)
Claims percentage for freight costs
Customer order promised cycle time
Defects per million opportunities
Inventory months of supply
On-time line count
On-time pickups
Pick exceptions rate
Percentage of picks with exceptions
Pick release to ship
Planned inventory turns
Planned cost of goods sold/planned inventory value
Planned margin
Planned revenue - Planned costs
Planned margin percentage
Planned margin/planned revenue
Planned on-time shipment
Planned service level (percentage of shipments shipped on time)
Planned resource utilization
Planned resource usage
Product revenue
Product sales revenue (not including service) recognized in selected period (based on AR invoice lines)
Product revenue backlog
Value of booked order lines less returns plus deferred revenue backlog (invoiced but not recognized)
Production value
Value of work-in-process (WIP) completions into inventory
Production to plan rate
Production standard value/planned standard value
Receipt to put-away
Time elapsed from pick release to ship confirm
Time elapsed from receipt
Transit time
Utilities
Annual labor cost per device
Average cost per job category
Average cost per megawatt produced
Average labor hours per device per year
Average maintenance cost per mile of pipe/line/cable
Average number of days each work order is past due
Average number of labor hours to complete a maintenance task
Average response time to fix breaks
Average revenue per megawatt produced
Average time to settle a rate case
Consumption analyzed by units consumed and target reduction achieved
Crew productivity
Drinking water quality - Percentage of water tests that meet regulatory standards
Electrical grid load
Equipment failure rate
Equipment unavailability, hours per year - Planned maintenance
Equipment unavailability, hours per year - Sustained fault
Equipment unavailability, hours per year - Temporary fault
Equipment unavailability, hours per year - Unplanned maintenance
Maintenance backlog
Maintenance cost as a percentage of manufacturing cost
Maintenance technician's skill level improvement, year over-year
Mean time to repair
Number of complaints received by type
Number of customers who were cut off due to violations of regulations
Number of disconnections
Number of pending work orders
Number of power failures per year
Number of reported gas leakages per 1,000 households
Number of sewage blockages per month/year
Number of staff per 1,000 customer connections
Number of uncontrolled sewage overflows affecting private properties
Outage time per event
Percentage of customers that would characterize their bills as accurate and timely
Percentage of possible power revenue billed
Percentage reduction in number of complaints to the local regulatory body
Percentage reduction in number of employee injuries
Percentage reduction in number of equipment failures
Percentage of maintenance work orders requiring rework
Percentage of man-hours used for proactive work
Percentage of scheduled man-hours to total man-hours
Profit redistribution (rural electric coops)
Reduction in hazardous liquid spill notification time
Reduction or stabilization in rates (municipally owned utilities)
Response time to gas or water leaks
Sewage system reliability
Station unavailability - Planned maintenance
Station unavailability - Sustained fault
Station unavailability - Temporary fault
Total shareholder returns (investor-owned utilities)
Total time to complete new customer connections
Transformer/pump station reliability
Voltage deviations per year
Water system reliability
Wholesale Trade
Dock turnaround time
Freight costs (minimize costs without affecting deliveries)
Inventory accuracy, stockouts
Inventory carrying costs
Inventory turns per year
Logistics costs per year
Low-velocity inventory comparison through sectors
Order fill rate and accuracy
Technology used to execute inventory strategies
Warehouse flow-through (or some measure of yard or warehouse productivity)
Wholesale revenue
Total factor productivity
Labor productivity
Return on assets
Profit margin
Debt to equity
Inventory turnover
Asset utilization
Collection efficiency
